
Find answers about implementation, virtual try-on, product visualization, integrations, analytics, and account support.
What results are collected and shared by Tangiblee throughout the lifetime of the partnership?
Tangiblee has built an analytics portal for our clients called the Tangiblee Management Portal (TMP). Each client is given access to the TMP where they are able to access results at any time.
Within the TMP, clients can view usage, Revenue per Visitor (RPV), Conversion rates, active product lists, and any products that may be missing relevant data.
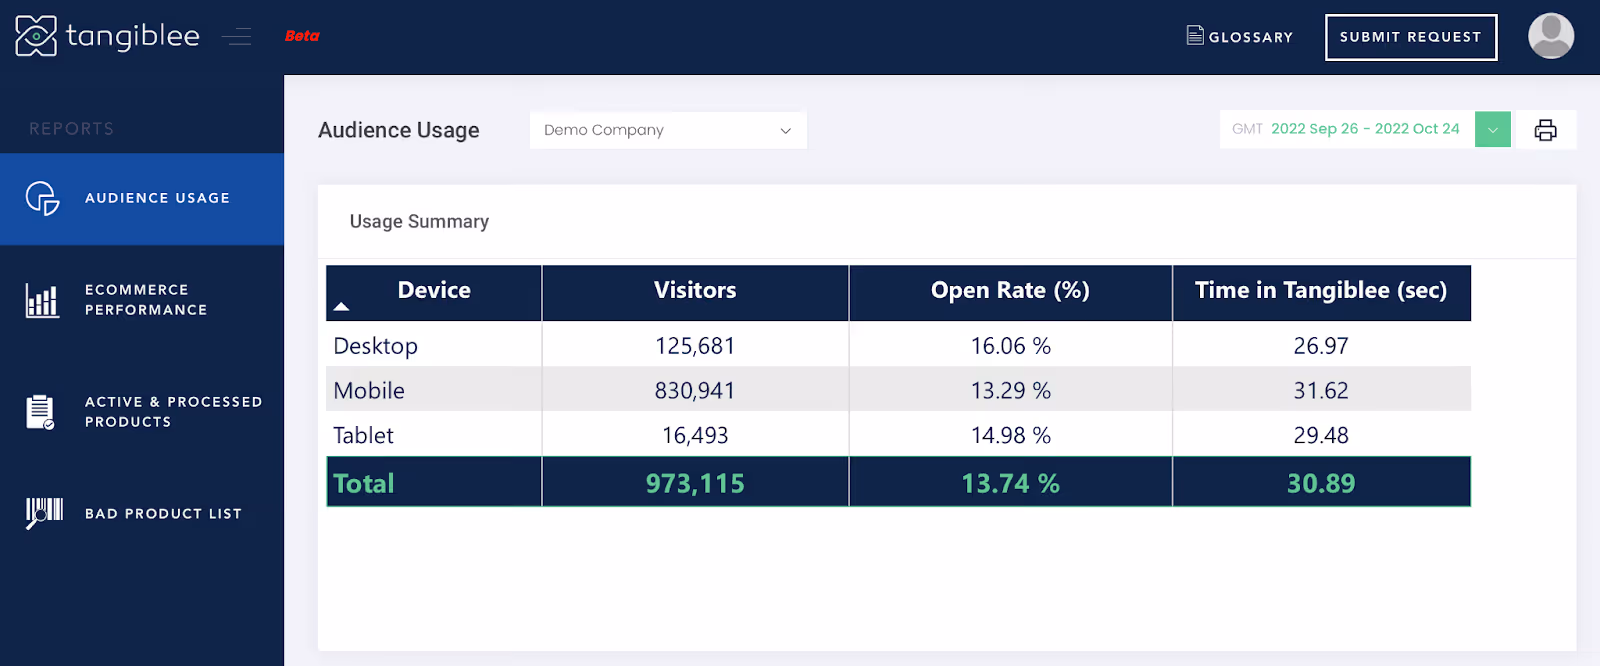
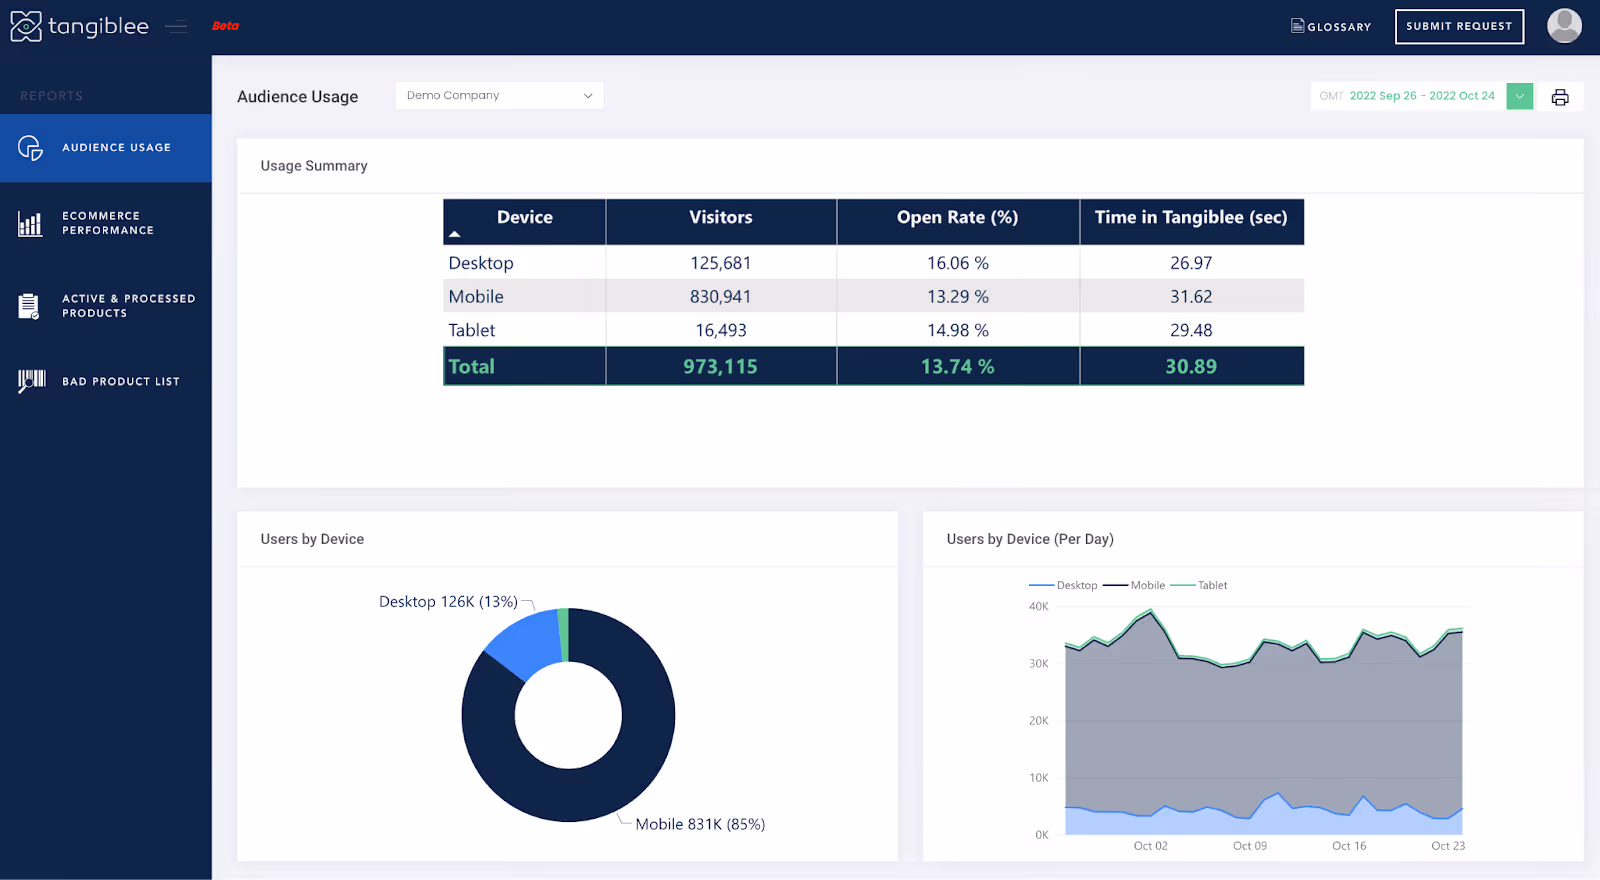
Usage Stats:
- Click Through Rate of Desktop, Mobile, and Tablet
- Time in Session of Desktop, Mobile, and Tablet
Example Stats (Not Actual Results)
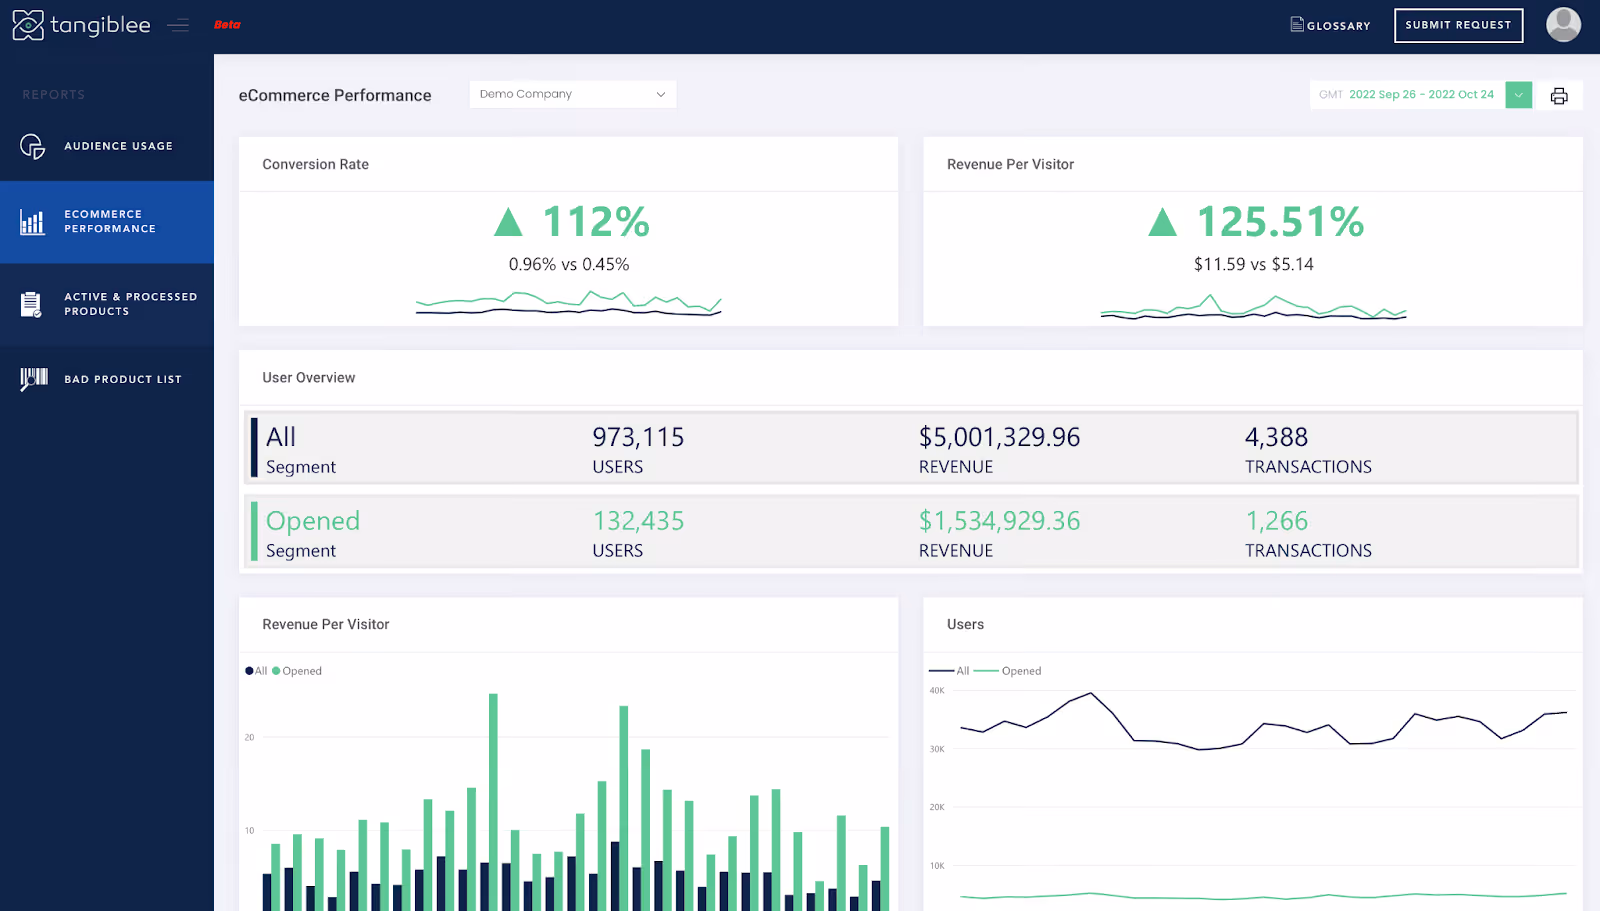
E-commerce Stats:
- Revenue Per Visitor of visitors who use Tangiblee versus those who don't use Tangiblee
- Conversion Rate of visitors who use Tangiblee versus those who don't use Tangiblee
- Average Order Value of visitors who use Tangiblee versus those who don't use Tangiblee
Example Stats (Not Actual Results)
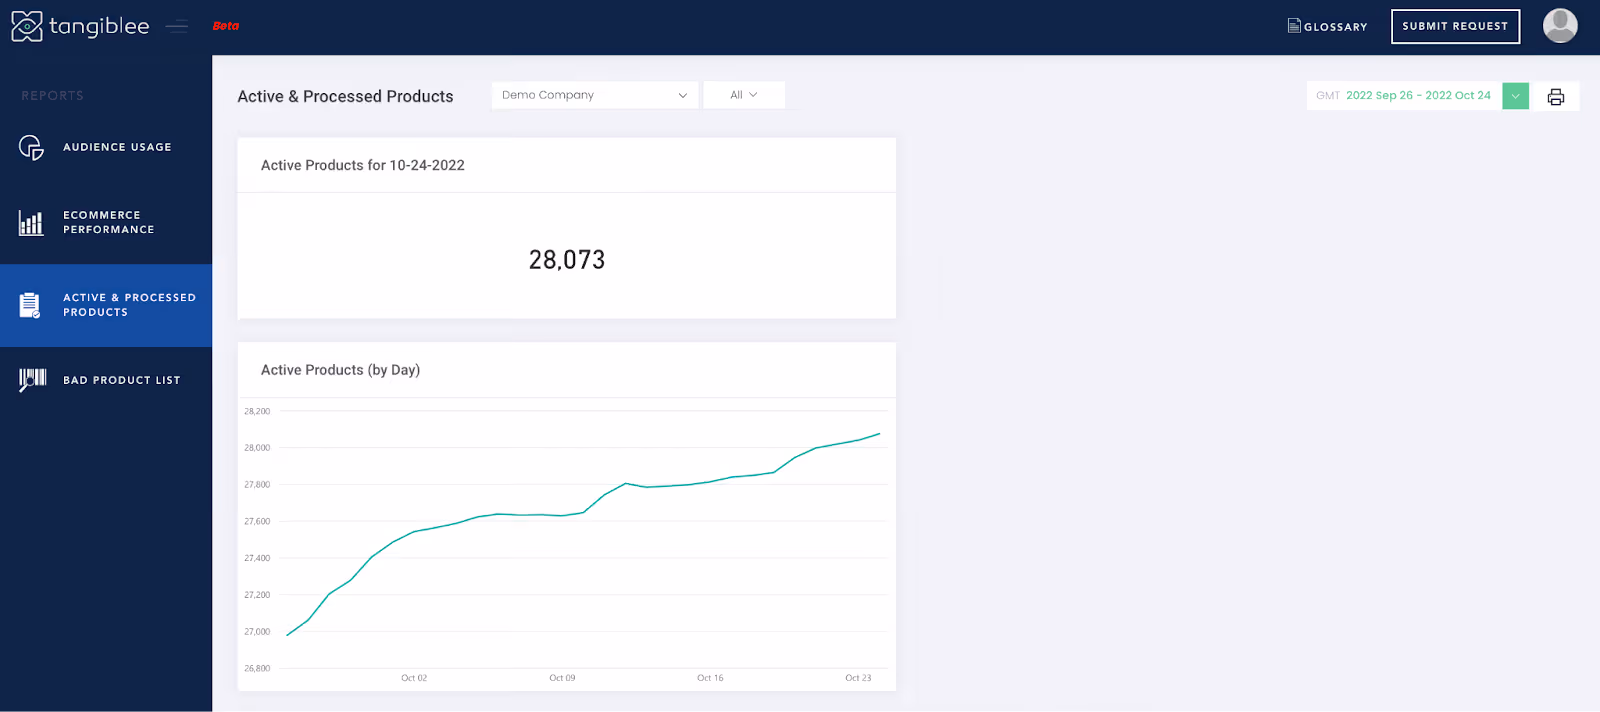
Active & Processed Products:
- Active products
- Active products by day
- Detailed list of active products and approved SKUs
Example Stats (Not Actual Results)
If this data is not enough for the client's internal analysis, our analytical team is ready to provide a custom report that includes the following information:
- Users, Time, Open Rate
- Open Rate by SKU
- Time in Widget by SKU
- Open Rate by CTA
- E-commerce - Use vs Not Use: Overview
- E-commerce - Use vs Not Use: Transactions
- E-commerce - Use vs Not Use: Lift by Category
- E-commerce - AR vs Not AR
- Widget Modes - Default and Selected
- Widget Experience - Switches
- UI Actions, Top Selected Items - STD
- UI Actions, Top Selected Items - AR
- Selected Items Widget by Experience
- ATC Rate - Use vs Not Use
These reports will help clients analyze Tangiblee's current performance and see the value reached.
shared metrics, ongoing reporting, usage results, conversion impact, revenue metrics, product coverage
Tangiblee shares ongoing performance reports with clients — usage data, conversion lift, revenue impact, and product health metrics. Learn what's reported and on what cadence.